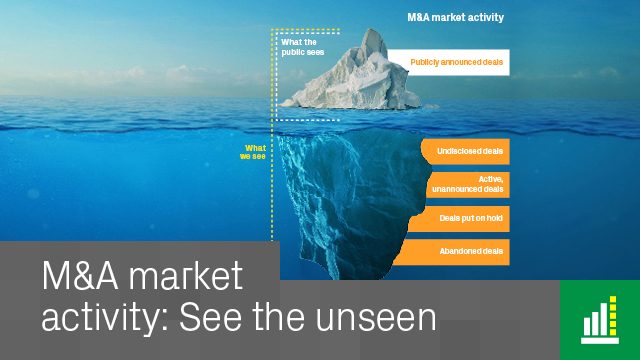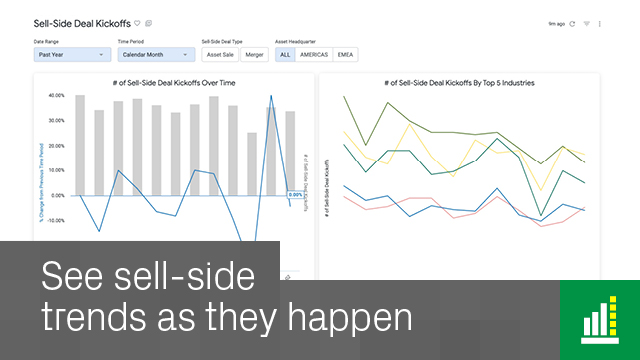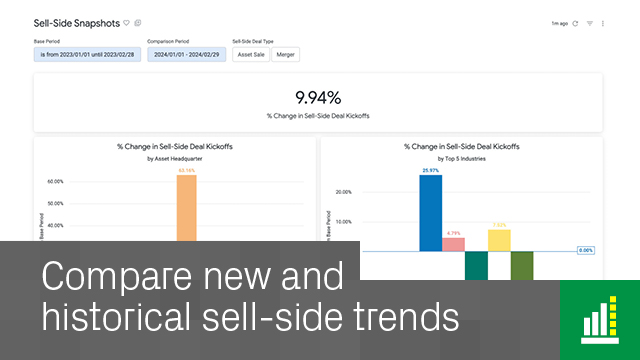


What is Forecaster Live? Forecaster Live is an M&A Forecasting tool, drawing on exclusive deal data to monitor various kinds of M&A activity, and identify trends as soon as they appear.
Who uses Forecaster Live? Anyone involved in sell-side M&A who wants to stay ahead of the curve and understand the current state of the market in more depth.
How do I use Forecaster Live? You can view both deal kickoffs and activity snapshots.
Do I have to pay to use Forecaster Live? It’s free to use Forecaster Live – all you need is a Datasite account. Open one free of charge here.
What data does Forecaster Live use? The Forecaster uses Datasite’s proprietary data drawn from 14,000 deals per year and more than 2 million users, all aggregated and anonymized. This ensures that insights are statistically sound and based solely on real-world activity.
Can I access the underlying data, e.g. for a specific region or industry? Please ask your Datasite contact if you have a specific data request. All data provided will be aggregated and anonymized to protect confidentiality.
Can I get regular updates on key topics? You can! Just sign up for Forecaster Bites to get regular updates on specific market segments. Just click the Sign Up button in the Forecaster.
Where can I find the Forecaster Live app? You’ll find Forecaster Live on the Datasite Apps page.
5
(5)
4
(0)
3
(0)
2
(0)
1
(0)
暫無評論
該應用程式尚無任何評論。